
Initial Balance Breaks
“Initial Balance Breaks” looks to see how often, historically, price breaks the initial balance high, low and over all total. Initial Balance or IB is calculated by using the high and low set between 9:30am and 10:30am ET.
The below metrics were calculated from a 10yr sample, 2014-2024. Times listed are in Eastern Standard.
Here we are looking at Initial Balance as it relates to breaking before the NY session ends at 4pm ET.
IB Breaks Before NY Session Ends (4pm ET)

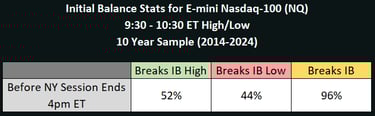
In the above, we see that IB is broken, in general, 96% of the time historically over the last 10 years, prior to 4pm ET. In other words, historically, either the high or low set between 9:30am to 10:30am ET broke 96% of the time, before 4pm ET.
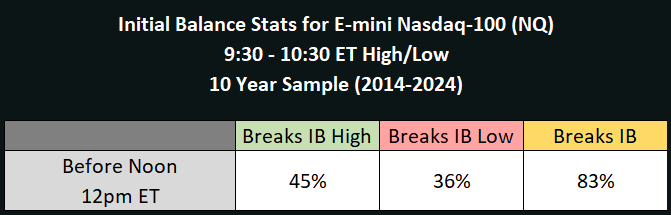
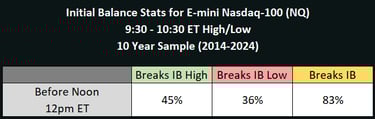
IB Breaks Before 12pm ET
What about narrowing the focus to IB breaking before "lunch" or 12pm ET? I myself prefer to only trade the morning half of the NY session, so I would much rather know this metric personally.
In the above, we see that IB is broke, in general, 83% of the time historically over the last 10 years, prior to 12pm ET. In other words, historically, either the high or low set between 9:30am to 10:30am ET broke 83% of the time, before 12pm ET.

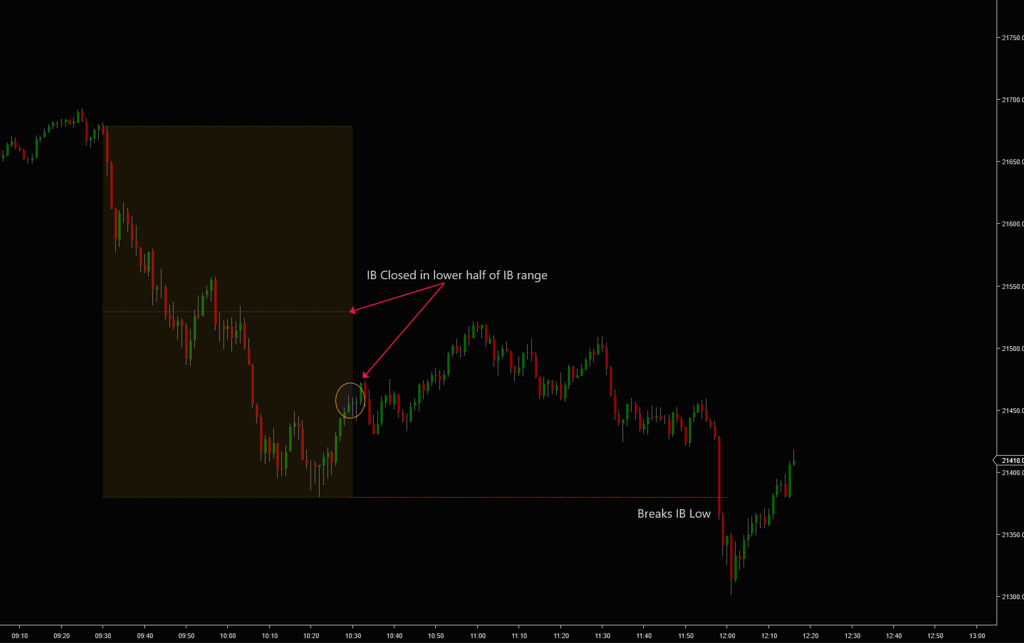
What Side Will Break?
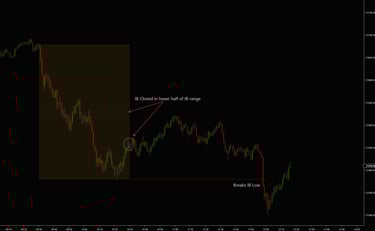
What side breaks is correlated to two factors. Whether the IB closes above or below the IB mid point. And whether the IB high or low was set first. These conditions are heavily correlated to what side of the IB range will break, as shown below.
Mid Point
When IB closed above the IB mid point, 81% of breaks occurred to the upside.
When IB closed below the IB mid point, 74% of breaks occurred to the downside.
IB High vs Low
When IB low was set first and the high was set last, 79% of breaks occurred to the upside.
When IB high was set first and the low was set last, 73% of breaks occurred to the downside.
Combined factors
Closed above mid and low set first, 86% of breaks occurred to the upside.
Closed below mid and high set first, 85% of breaks occurred to the downside.
Click the image below to enlarge.